Lecture 3: Dummy Q-learning (table)
import gym
import numpy as np
import matplotlib.pyplot as plt
from gym.envs.registration import register
import random as pr
def rargmax(vector) :
""" Argmax that chooses randomly among eligible maximum indices. """
m = np.amax(vector)
indices = np.nonzero(vector == m)[0]
return pr.choice(indices)
register(
id='FrozenLake-v3',
entry_point='gym.envs.toy_text:FrozenLakeEnv',
kwargs={'map_name': '4x4',
'is_slippery': False}
)
env = gym.make('FrozenLake-v3')
Q = np.zeros([env.observation_space.n, env.action_space.n])
num_episodes = 2000
rList = []
for i in range(num_episodes):
state = env.reset()
rAll = 0
done = False
while not done:
action = rargmax(Q[state, :])
new_state, reward, done,_ = env.step(action)
Q[state,action] = reward + np.max(Q[new_state,:])
rAll += reward
state = new_state
rList.append(rAll)
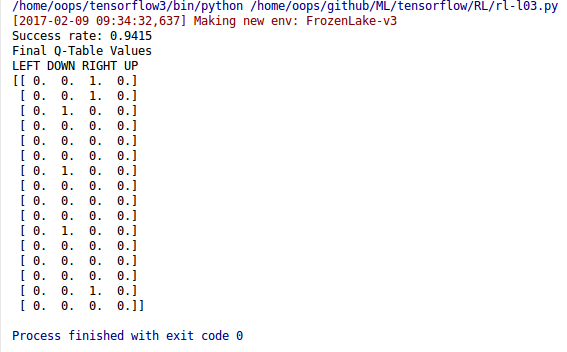
print("Success rate: " + str(sum(rList)/num_episodes))
print("Final Q-Table Values")
print("LEFT DOWN RIGHT UP")
print(Q)
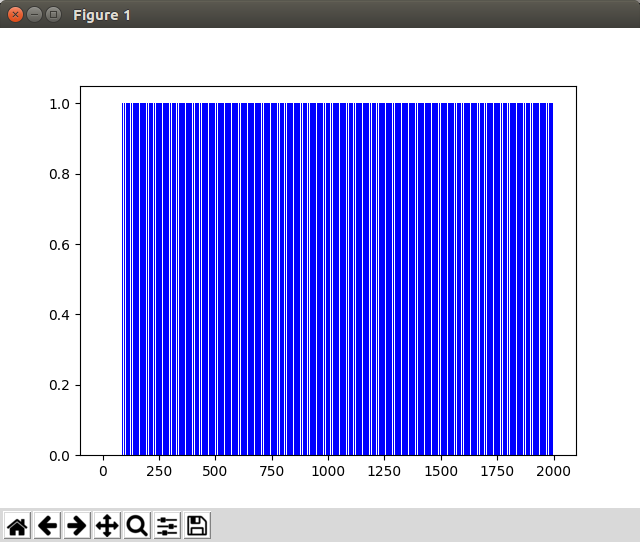
plt.bar(range(len(rList)), rList, color="blue", edgecolor='none')
plt.show()
실행 결과
그래프